Struck by a Vehicle: 2% of Workplace Injuries, 16% of Deaths
This page sets out what HSE's published statistics say about vehicles and people at work. It quotes HSE's numbers as HSE publishes them; we have not re-cut or combined anything, so every figure can be checked against the source document named beside it.
How many people are killed by workplace vehicles in Great Britain?
In 2025/26, 126 workers were killed in work-related accidents (provisional). Being struck by a moving vehicle was the second most common cause, with 24 deaths, behind falls from a height (31) and ahead of being struck by a moving object (21).
Over the five years 2020/21 to 2024/25, which HSE uses to give a stable picture of causes:
| Accident kind, fatal injuries to workers | Share of deaths | Average per year |
|---|---|---|
| Falls from a height | 28% | 38 |
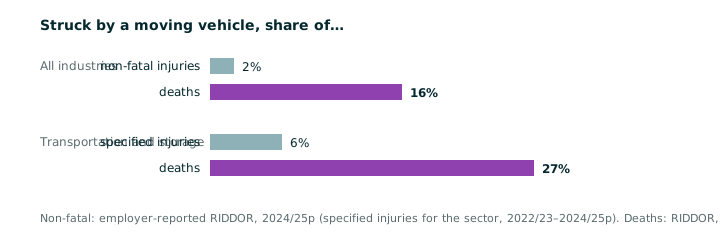
| Struck by moving vehicle | 16% | 21 |
| Struck by moving, including flying or falling, object | 15% | 21 |
| Trapped by something collapsing or overturning | 11% | — |
| Contact with moving machinery | 9% | — |
Source: HSE, Kind of accident statistics in Great Britain 2025, Figure 1 (RIDDOR, 2020/21–2024/25p). 666 fatal injuries over the period, an annual average of 133.
Together, falls, vehicles and moving objects account for around 60% of all work-related deaths, and have done every year since at least 2001/02.
Which sectors have the highest share of vehicle deaths?
The proportion of worker deaths caused by being struck by a moving vehicle varies a great deal by sector. HSE reports it as markedly higher than the 16% average in three:
| Sector | Share of worker deaths struck by moving vehicle | Average deaths per year |
|---|---|---|
| Water supply, sewerage, waste management and remediation | 40% | 2 |
| Transportation and storage | 27% | 4 |
| Agriculture, forestry and fishing | 23% | 6 |
| Construction | 9% | 4 |
| All industries | 16% | 21 |
Source: HSE, Kind of accident statistics in Great Britain 2025 (RIDDOR, 2020/21–2024/25p).
Construction is worth a second look: a lower share, because falls dominate there, but the same four deaths a year as transportation and storage.
How dangerous is transportation and storage?
HSE's sector report gives the headline figures:
- 15 workers were killed in transportation and storage in 2024/25 (provisional), against a five-year average of 13.
- 29 members of the public were killed in the sector's activities in the same year, against a five-year average of 23.
- The sector's fatal injury rate is 0.87 per 100,000 workers, around 2.2 times the all-industry rate of 0.4.
- Around 40,000 workers a year sustain a non-fatal injury (Labour Force Survey, average 2022/23–2024/25); 24% of those resulted in more than seven days' absence.
- 2.4% of workers in the sector sustained a workplace injury, statistically significantly higher than the all-industry 1.8%.
Source: HSE, Transportation and storage statistics in Great Britain 2025, pp. 17–19.
Within the sector, HSE gives an eight-year average rate of self-reported non-fatal injury by sub-sector:
| Sub-sector | Non-fatal injury rate per 100,000 workers |
|---|---|
| Post and courier | 3,570 (3.6%) |
| Warehousing | 2,610 (2.6%) |
| Road haulage | 2,060 (2.1%) |
| Transport | 1,080 (1.1%) |
| Transportation and storage, all | 2,100 (2.1%) |
| All industries | 1,710 (1.7%) |
Source: HSE, Transportation and storage statistics in Great Britain 2025, p. 20 (LFS, average 2017/18–2024/25). Confidence intervals are wide for sub-sectors; see the source.
Why do the non-fatal numbers look so different from the fatal ones?
This is the finding that matters, and HSE states it plainly: the profile of non-fatal injuries "differs quite markedly" from the profile of fatal injuries.
Employer-reported non-fatal injuries to employees in 2024/25, all industries:
| Accident kind | Share of reported non-fatal injuries |
|---|---|
| Slips, trips or falls on same level | 30% |
| Injured while handling, lifting or carrying | 17% |
| Struck by moving object | 10% |
| Acts of violence | 10% |
| Falls from a height | 8% |
| Strike against something fixed or stationary | 4% |
| Contact with moving machinery | 4% |
| Struck by moving vehicle | 2% |
Source: HSE, Kind of accident statistics in Great Britain 2025, Figure 2 (RIDDOR, 2024/25p).
In transportation and storage, employers reported 7,698 non-fatal injuries under RIDDOR in 2024/25: 1,929 specified injuries and 5,769 over-seven-day injuries. Of the specified injuries, 45% were slips, trips and falls, 20% falls from height, and 6% struck by a moving vehicle.
So vehicles are 2% of reported injuries nationally and 6% of serious injuries in the sector most exposed to them, but 16% and 27% respectively of deaths. Two things explain the gap, and both are in HSE's own notes.
First, the outcome distribution. A slip usually produces a sprain; a vehicle strike at a loading bay produces a fatality or a specified injury or nothing at all. There is very little in between.
Second, what the statistics can see. RIDDOR records injuries and a defined list of dangerous occurrences. A forklift that passes a metre from a pedestrian is neither, so it does not exist in these tables. HSE's footnote adds that non-fatal injuries are "substantially under-reported by employers" in any case. The events that precede a vehicle death are the ones the national data is structurally unable to count.
The events that precede a vehicle death are the ones the national statistics are structurally unable to count.
What does it cost?
HSE estimates the total cost of work-related injury and ill health in transportation and storage at £1.4 billion in 2023/24 (95% confidence interval £955m to £1,937m), 6% of the £22.9 billion all-industry total, with around 2.3 million working days lost in the sector each year.
Source: HSE, Transportation and storage statistics in Great Britain 2025, pp. 24–25 (Costs to Britain model, 2023/24 prices).
How should a site read these figures?
As a reason to look where the numbers cannot. A site's own injury log will, in a normal year, show slips and handling injuries and very little involving vehicles, and that is a true picture of its injuries. It is not a picture of its vehicle risk, because vehicle risk expresses itself in near misses for years and then, once, in a death.
The national figures say the sector is twice as likely as average to kill a worker, that vehicles are the cause more than a quarter of the time, and that the injury data will give almost no warning. The useful question for a site is therefore not "how many vehicle injuries did we have?" but "how many times did we come close, and would we know?"
Common questions
How many people are killed by forklifts in the UK each year?
HSE does not publish a forklift-specific count in its headline statistics. Its category "struck by a moving vehicle" covers all vehicles at work and accounted for 16% of worker deaths over 2020/21 to 2024/25, an average of 21 a year, and 24 deaths in 2025/26 (provisional). Forklift incidents are a subset of that figure.
What is the fatal injury rate in transportation and storage?
0.87 per 100,000 workers, averaged over 2020/21 to 2024/25, around 2.2 times the all-industry rate of 0.4. Fifteen workers and 29 members of the public died in the sector's activities in 2024/25 (provisional).
What is the most common cause of workplace death in Great Britain?
Falls from a height, at 28% of worker deaths over 2020/21 to 2024/25. Being struck by a moving vehicle is second at 16%, and being struck by a moving or falling object third at 15%.
Why are vehicle injuries such a small share of RIDDOR reports?
Because vehicle incidents rarely produce the moderate injuries that make up most reports. They tend to produce either a serious or fatal injury, or no injury at all. Near misses with no injury are not reportable under RIDDOR and do not appear in national statistics.
How reliable are these figures?
Fatal injury counts from RIDDOR are considered close to complete. Non-fatal RIDDOR figures are known to be substantially under-reported, which is why HSE prefers the Labour Force Survey for scale. Figures for the latest year are provisional. All numbers here are quoted directly from the HSE publications named in the sources box.
Where can I find the underlying tables?
HSE publishes them as spreadsheets: RIDKIND (injuries by accident kind), RIDIND (by industry) and LFSINJIND (Labour Force Survey injuries by industry), all at hse.gov.uk/statistics.
References
- Health and Safety Executive (2025). Kind of accident statistics in Great Britain, 2025. Published 20 November 2025. hse.gov.uk/statistics.
- Health and Safety Executive (2025). Transportation and storage statistics in Great Britain, 2025. Published 20 November 2025. hse.gov.uk/statistics.
- Health and Safety Executive (2026). Work-related fatal injuries in Great Britain, statistics page, 2025/26 provisional. Updated 30 June 2026.
- Health and Safety Executive. RIDDOR data tables RIDKIND, RIDIND, RIDFATAL; Labour Force Survey table LFSINJIND. hse.gov.uk/statistics.
- Health and Safety Executive (2014). A guide to workplace transport safety (HSG136), 3rd edition. HSE Books.
- Open Government Licence v3.0, The National Archives.
Published 27 October 2026 · Last updated 27 October 2026
This piece starts from the ideas set out in How We Think About Safety.
Wondering what a camera would see at your gate? Request a Safety Mapping — one camera, two weeks, at no cost.